Within Paper Preview
Can figures tell you what a paper proves?
Figures and captions often show the evidence behind a paper's claim before the full text explains it.
On this page
- What figures show before the text does
- How captions compress the evidence
- When visual results need skeptical checking
Page outline Jump by section
Introduction
When you are previewing a research paper to increase reading speed, the fastest route to the paper’s main claim is often not the introduction or methods section. It is the figures. In many disciplines, the central evidence appears first in graphs, charts, images, tables and their captions. Authors may spend pages explaining context and methodology, but the visual results usually show what the paper is trying to prove in a matter of seconds. Experienced researchers therefore often inspect the figures before committing to a full read. The goal is not to replace careful reading but to answer a practical question quickly: What evidence is this paper presenting, and does it support a meaningful claim? [CCR]ccr.sigcomm.orgFirst, use an academic search engine such as Google Scholar…

Can figures tell you what a paper proves?
Often, yes. A well-designed figure is a compressed argument. Instead of reading several pages of results, a reader can inspect the visual evidence and infer the paper’s central message.
For example:
- A graph showing one treatment consistently outperforming another suggests the paper’s main claim is about improved performance.
- A scatter plot showing a strong relationship between two variables suggests the claim concerns correlation or prediction.
- A diagram comparing an existing method with a new one often reveals the claimed innovation.
- A table highlighting large differences between groups may reveal the paper’s primary finding before the discussion section states it directly.
Scientific communication guides consistently emphasise that figures are intended to make complex findings understandable at a glance. In many papers, the figures are not supplementary illustrations; they are the core presentation of the results. [PMC+2annaclemens.com]pmc.ncbi.nlm.nih.govPMCUtilizing tables, figures, charts and graphs to enhanceby CA Divecha · 2023 · Cited by 61 — Tables, figures, graphs, and supplementary materials are vital tools which, when skillfully used…
For a reader conducting a rapid preview, the question is not whether every detail is understood. The question is whether the figures reveal the paper’s central evidence. If they do, you can often summarise the paper’s main contribution before reading most of the text.
What figures show before the text does
Figures frequently reveal three critical pieces of information faster than prose.
The outcome
The most obvious function of a figure is to show what happened. A graph can reveal success, failure, improvement, decline or no meaningful effect almost instantly.
Suppose a paper introduces a new machine-learning model. The figure may show accuracy scores across benchmarks. If the new model consistently scores higher, the paper’s claim becomes immediately visible. You do not yet know every methodological detail, but you understand the direction of the argument.
The size of the effect
A paper may claim that an intervention improves performance, but figures often reveal whether the improvement is substantial or trivial.
A difference of 0.2% and a difference of 20% might both be described as improvements in the text. A graph makes the magnitude visible immediately.
This is one reason visual evidence is so valuable during a preview. It helps readers estimate importance before investing time in technical details. [BCCampus Pressbooks]pressbooks.bccampus.caPressbooks3.4 Figures and Tables – Technical Writing EssentialsBCCampus Pressbooks3.4 Figures and Tables – Technical Writing EssentialsJanuary 1, 2019 — Visual elements such as graphs, charts, tables…
The scope of the evidence
A figure also reveals how broadly a claim is supported.
Ask questions such as:
- Is the result based on ten observations or ten thousand?
- Does the pattern appear across multiple datasets?
- Are several experiments pointing in the same direction?
- Does the result depend on one unusual condition?
A quick inspection of figures often answers these questions more efficiently than reading several pages of narrative description.
How captions compress the evidence
Many readers glance at figures but skip captions. During a paper preview, this is a mistake.
Captions are often designed to make figures understandable without requiring extensive reference to the surrounding text. Academic writing guidance commonly recommends that figures and captions be largely self-contained. [EASE+2The Writing Center]ease.org.ukFigures and tables - European Association of Science EditorsFigures and tables should be self-explanatory and understandable through…
A strong caption typically tells you:
- What is being measured.
- Which groups or conditions are being compared.
- What the symbols, colours or lines represent.
- What result the authors want readers to notice.
Modern scientific writing increasingly uses captions that explicitly state the key finding rather than merely describing the contents of the figure. Instead of saying “Relationship between X and Y”, a caption may effectively say “X increases as Y increases”. That shift helps readers grasp the intended conclusion immediately. [International Science Editing]internationalscienceediting.comhow to write a figure captionInternational Science EditingHow to write a figure caption9 Jan 2020 — In this blog, we discuss how to write a figure caption, focusing o…
For rapid paper assessment, a useful technique is to read captions before reading the corresponding results section. If you can explain the figure after reading the caption, you have probably identified one of the paper’s major claims.

Finding the paper’s main claim through figure order
Authors usually arrange figures strategically.
The earliest figures often establish the problem or dataset. Later figures typically contain the strongest evidence supporting the paper’s contribution. The final figures may explore limitations, variations or additional analyses.
When previewing a paper: [richardmathewsii.substack.com]richardmathewsii.substack.comthree pass research literature reviewThree-Pass Method for Literature ReviewHere are some steps to follow when conducting a first pass: Step 1: Skim the Paper. The first pass…
- Scan all figure titles and captions.
- Identify which figure appears most central to the paper’s argument.
- Ask what conclusion that figure is intended to support.
- Check whether later figures reinforce or qualify that conclusion.
In many papers, one or two figures carry most of the argumentative weight. Locating those figures can dramatically reduce the time needed to understand the paper’s purpose.
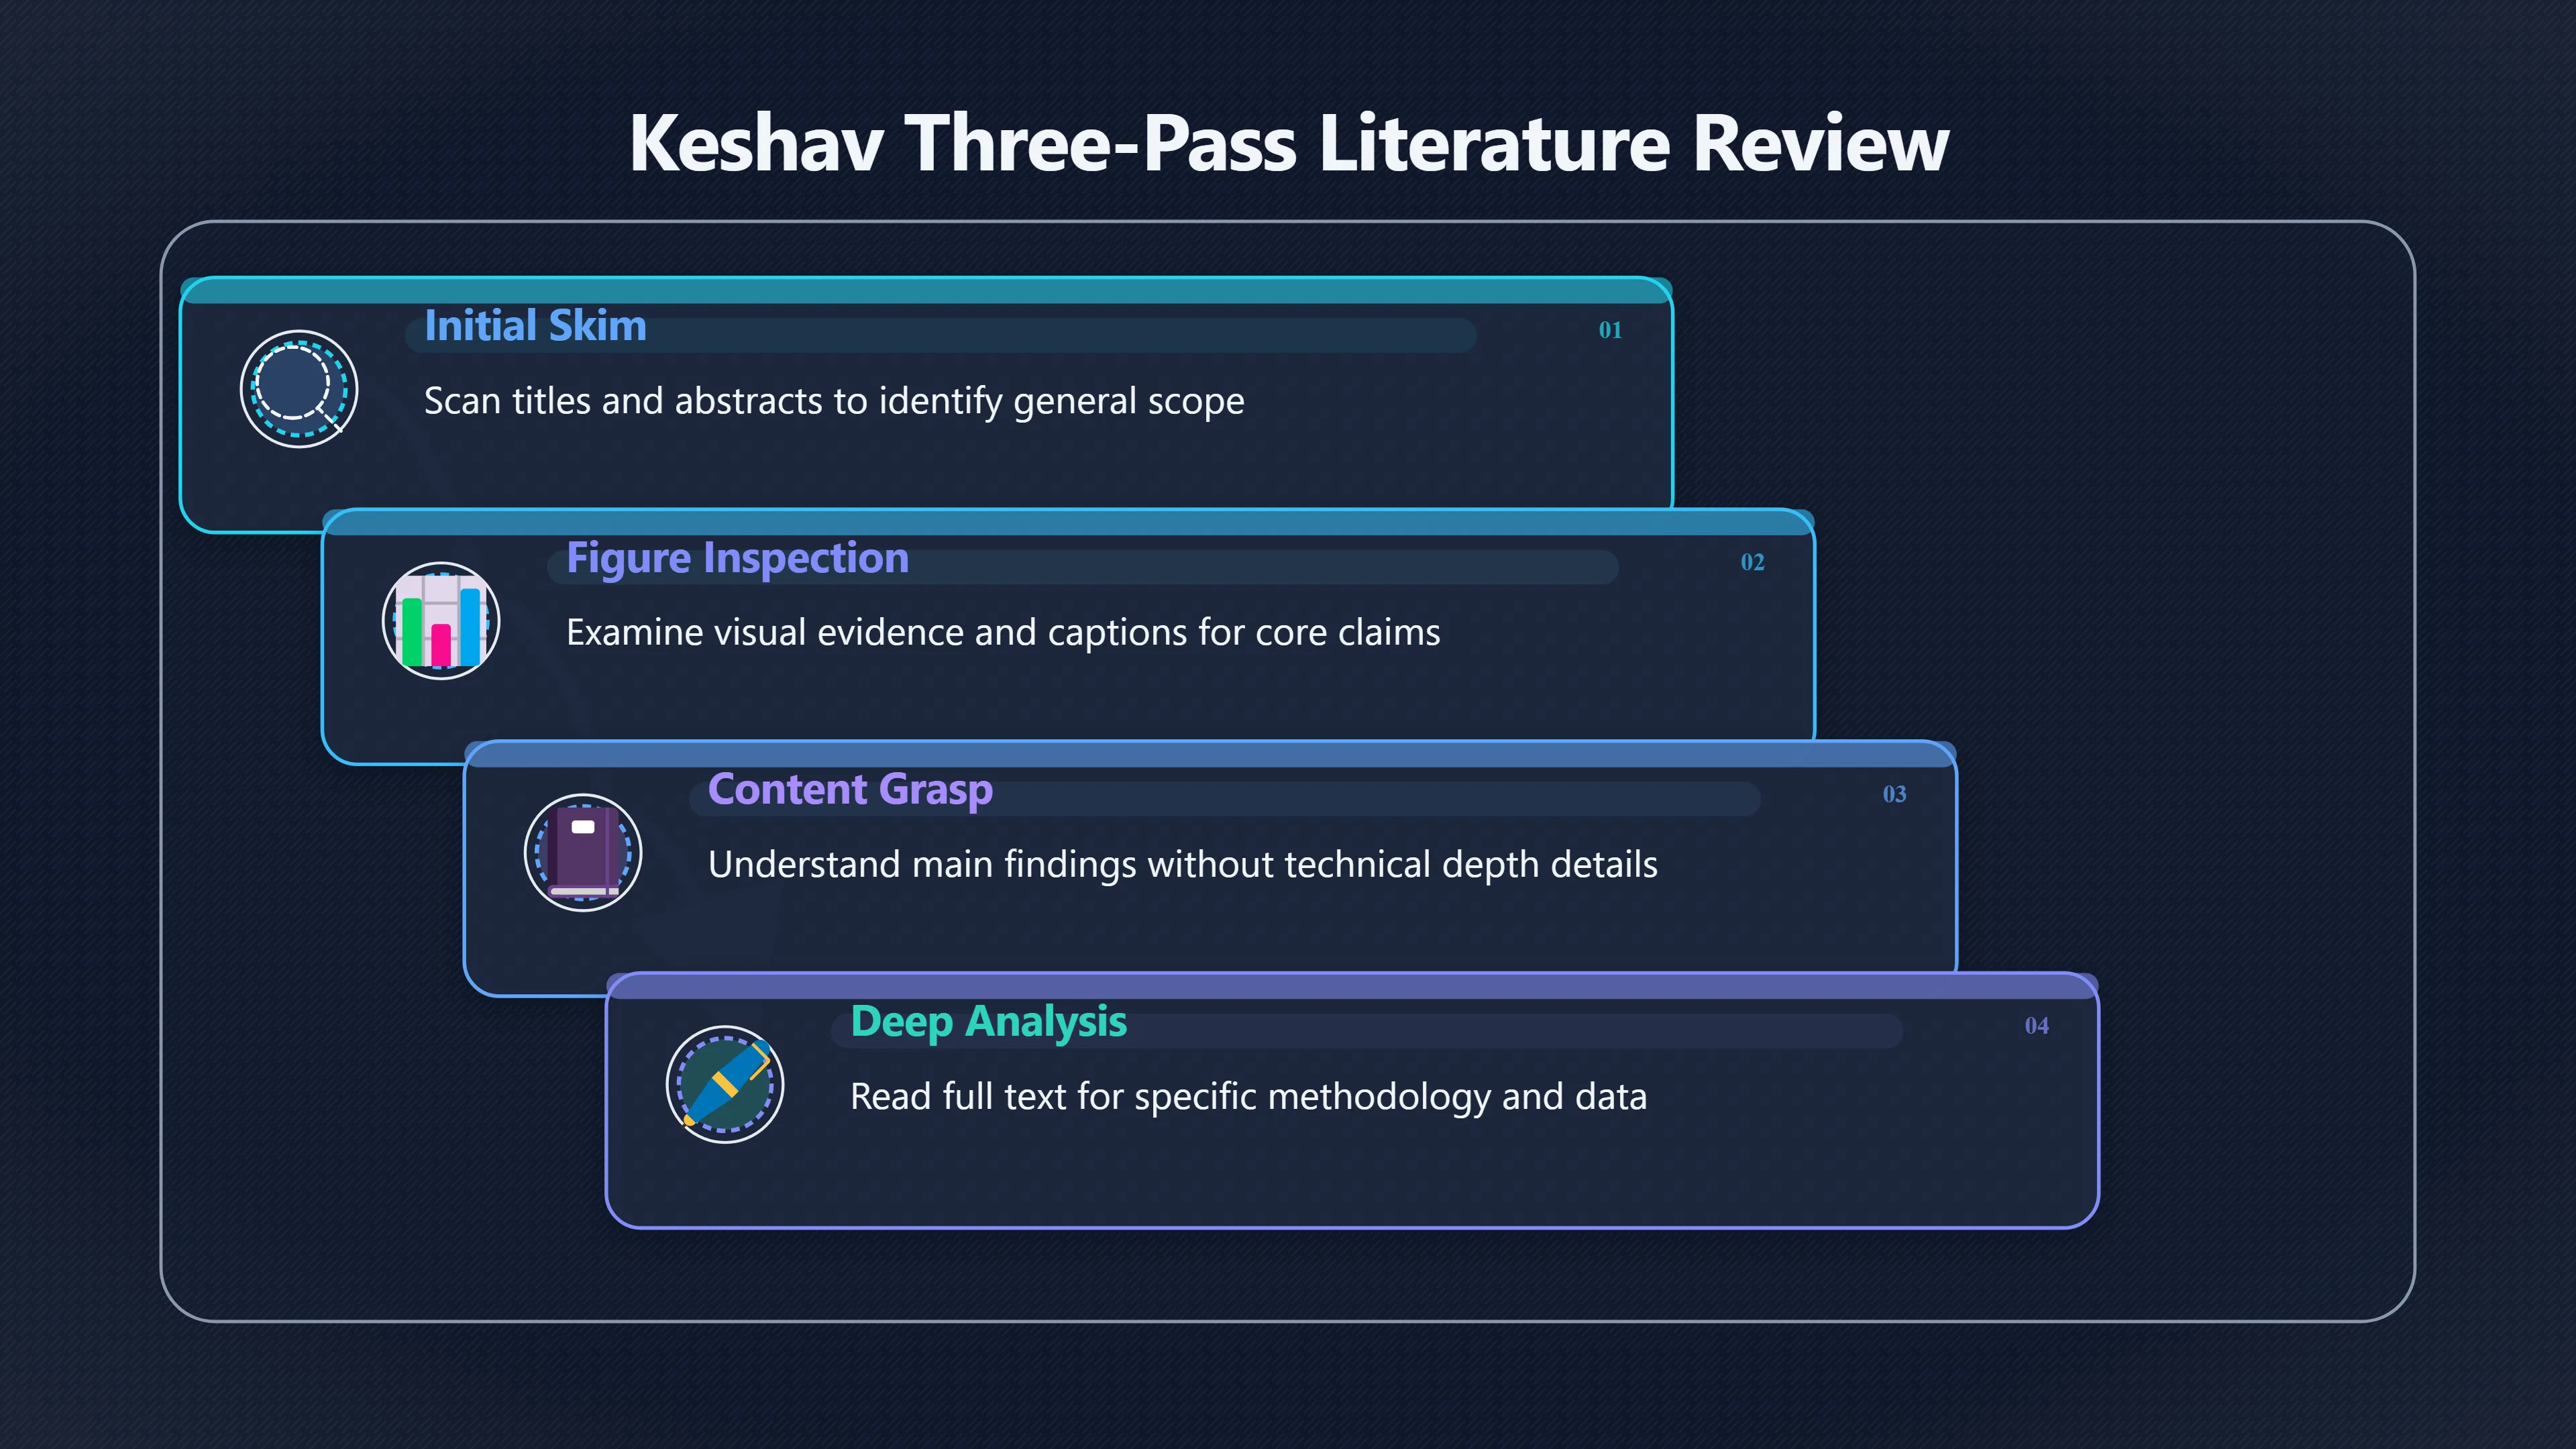
This aligns with reading strategies such as Srinivasan Keshav’s widely cited three-pass approach, which specifically recommends careful attention to figures during an early reading pass because they reveal the supporting evidence behind the paper’s claims. [CCR+2Studocu]ccr.sigcomm.orgFirst, use an academic search engine such as Google Scholar…
When visual results need skeptical checking
Figures are powerful, but they should not be accepted uncritically.
A rapid preview should include a few credibility checks.
Are the axes and scales sensible?
Graphs can exaggerate or minimise effects through axis choices. A dramatic-looking difference may shrink considerably when viewed on a more appropriate scale.
Are uncertainty measures shown?
Error bars, confidence intervals and similar indicators help readers judge whether differences may simply reflect random variation.
Keshav’s reading framework specifically recommends checking whether graphs include proper labels and uncertainty information because these details often distinguish strong evidence from weak evidence. [Studocu]studeersnel.nlStudocuHow to Read a Paper Efficiently: A Three-Pass Approach…The second pass lets you grasp the paper's content, but not its details…

Is the figure showing raw evidence or a processed summary?
A polished visual may hide important assumptions. Ask whether the figure presents direct observations, model outputs, averaged values or selected examples.
Does the caption overstate the result?
Sometimes the visual pattern is modest while the caption sounds definitive. A quick comparison between what the figure actually shows and what the caption claims can reveal whether the interpretation is stronger than the evidence.
A fast workflow for reading figures first
For readers trying to increase reading speed, a practical figure-first preview can take only a few minutes:
- Read the title and abstract.
- Flip directly to the figures and tables.
- Read every caption carefully.
- Identify the figure that appears to contain the strongest evidence.
- State the paper’s main claim in one sentence.
- Only then decide whether a full reading is necessary.
If you cannot identify the central claim after reviewing the figures and captions, the paper may be poorly organised, outside your expertise, or simply not relevant to your needs. If you can identify the claim, you enter the full reading phase with a mental map already formed.
That is why figures are often the fastest route to understanding a research paper. They do not merely illustrate the argument; they frequently are the argument, condensed into visual evidence that can be evaluated long before every paragraph has been read. [annaclemens.com+2PMC]annaclemens.comHow To Make Figures For Scientific PapersFigures are the central part of almost every scientific paper because they provide a visual repr…
Amazon book picks
Further Reading
Books and field guides related to Can figures tell you what a paper proves?. Use these as the next step if you want deeper reading beyond the article.
How to Read a Book
Rating: 4.0/5 from 41 Google Books ratings
Directly teaches adapting reading methods to difficult texts, including close and analytical reading.

How to Read Numbers
Builds skepticism toward numerical claims and teaches critical interpretation of statistical evidence.
The Visual Display of Quantitative Information
Helps readers interpret graphs, charts, and visual evidence—the exact skills needed to extract claims from figures.
Storytelling with Data
First published 2015. Subjects: Computer graphics, Business communication, Information visualization, Applied, General.
eBay marketplace picks
Marketplace Samples
Example marketplace items related to this page. Use the search link to explore similar finds on eBay.
Endnotes
-
Source: ccr.sigcomm.org
Link: https://ccr.sigcomm.org/online/files/p83-keshavA.pdfSource snippet
First, use an academic search engine such as Google Scholar...
-
Source: annaclemens.com
Link: https://annaclemens.com/blog/figure-graph-data-vizualisation-plot-scientific-paper/Source snippet
How To Make Figures For Scientific PapersFigures are the central part of almost every scientific paper because they provide a visual repr...
-
Source: pmc.ncbi.nlm.nih.gov
Title: PMCUtilizing tables, figures, charts and graphs to enhance
Link: https://pmc.ncbi.nlm.nih.gov/articles/PMC10394528/Source snippet
by CA Divecha · 2023 · Cited by 61 — Tables, figures, graphs, and supplementary materials are vital tools which, when skillfully used...
-
Source: pressbooks.bccampus.ca
Title: Pressbooks3.4 Figures and Tables – Technical Writing Essentials
Link: https://pressbooks.bccampus.ca/technicalwriting/chapter/figurestables/Source snippet
BCCampus Pressbooks3.4 Figures and Tables – Technical Writing EssentialsJanuary 1, 2019 — Visual elements such as graphs, charts, tables...
Published: January 1, 2019
-
Source: ease.org.uk
Link: https://ease.org.uk/learning-hub/author-toolkit-1/revising-your-draft-and-adding-details/figures-and-tables/Source snippet
Figures and tables - European Association of Science EditorsFigures and tables should be self-explanatory and understandable through...
-
Source: writingcenter.unc.edu
Title: The Writing Center Figures and Charts
Link: https://writingcenter.unc.edu/tips-and-tools/figures-and-charts/Source snippet
and Charts - The Writing CenterThis handout will describe how to use figures and tables to present complicated information in a way that...
-
Source: internationalscienceediting.com
Title: how to write a figure caption
Link: https://www.internationalscienceediting.com/how-to-write-a-figure-caption/Source snippet
International Science EditingHow to write a figure caption9 Jan 2020 — In this blog, we discuss how to write a figure caption, focusing o...
-
Source: studeersnel.nl
Link: https://www.studeersnel.nl/nl/document/universiteit-van-amsterdam/psychology-and-behaviour-in-organisations/skeshav-how-to-read-a-paper/61724405Source snippet
StudocuHow to Read a Paper Efficiently: A Three-Pass Approach...The second pass lets you grasp the paper's content, but not its details...
-
Source: pmc.ncbi.nlm.nih.gov
Link: https://pmc.ncbi.nlm.nih.gov/articles/PMC7392212/Source snippet
simple rules for reading a scientific paper - PMC - NIHby MA Carey · 2020 · Cited by 44 — We present 10 simple rules, relevant to novices...
Additional References
-
Source: sigaccess.org
Link: https://www.sigaccess.org/welcome-to-sigaccess/resources/describing-figures/Source snippet
Describing FiguresThis page gives examples and guidance on writing good descriptions for common types of computer science figures and off...
-
Source: bristol.ac.uk
Link: https://www.bristol.ac.uk/Depts/DeafStudiesTeaching/dissert/Figures%2C%20Tables%20%26%20References.htmSource snippet
Figures, Tables & ReferencesIn this chapter we will take a look at figures, tables and references. These are all important elements of re...
-
Source: wordvice.com
Link: https://wordvice.com/blog/writing-the-results-section-for-a-research-paper/Source snippet
How to Write the Results/Findings Section in ResearchThe Results/Findings section of a scientific research paper presents the core findin...
-
Source: linkedin.com
Link: https://www.linkedin.com/top-content/writing/writing-for-scientific-journals/the-role-of-figures-and-tables/Source snippet
The Role of Figures and TablesUnderstand the importance of figures and tables for clear communication in scientific papers. Follow tips t...
-
Source: paeditorial.co.uk
Link: https://paeditorial.co.uk/post/seeing-is-understanding-the-essential-role-of-figures-in-academic-research/Source snippet
The Essential Role of Figures in Academic ResearchResearchers are expected to communicate their findings with precision, and often, the m...
-
Source: blog-sc.hku.hk
Title: reading papers efficiently with the three pass approach
Link: https://blog-sc.hku.hk/reading-papers-efficiently-with-the-three-pass-approach/Source snippet
Papers Efficiently with the Three-pass Approach15 Apr 2024 — Keshav noted, the first pass helps readers to get a general idea of a paper...
-
Source: linkedin.com
Link: https://www.linkedin.com/posts/pverma_research-phd-academicresearch-activity-7459297296602652672-zAMDSource snippet
Srinivasan Keshav introduces the powerful Three-Pass Approach...
-
Source: richardmathewsii.substack.com
Title: three pass research literature review
Link: https://richardmathewsii.substack.com/p/three-pass-research-literature-reviewSource snippet
Three-Pass Method for Literature ReviewHere are some steps to follow when conducting a first pass: Step 1: Skim the Paper. The first pass...
-
Source: medium.com
Link: https://medium.com/%40gianyrox/why-the-three-pass-method-for-reading-research-papers-does-not-work-b679c8ffa4bbSource snippet
sp the paper's content, but not its details. The third...
-
Source: ref-n-write.com
Title: Figures and Tables in Research Papers
Link: https://www.ref-n-write.com/blog/figures-and-tables-in-research-papers-tips-and-examples/Source snippet
Tips and Examples28 Apr 2024 — In this blog, we will look at best practices for presenting tables and figures in your research paper...
Topic Tree